DEPARTMENT
OF LAND AND AGROFOREST ENVIRONMENTS
UNIVERSITY
OF PADOVA
Muskingum
One-Dimensional
Debris
flow Simualtion
(MODDS)
by
Mario A. Lenzi
The
main goal of the 1-D simulation is the location of critical cross-sections
along the channel, where the debris flow spreading on the fan begin for
a given scenario of event. In alpine areas fan slope of catchments where
debris flow may occur (basin area < 10 km2) are rarely lower
than 3%. Considering the
unsteady flow for a gradually varied open channel, the inertial terms
are negligible in the momentum equation in comparison with the bed slope.
In this case the Saint-Venant equations reduce to:
|

|
(1)
|
where:
t is the time; x the spatial
coordinate; Q
is the flow rate; c=dQ/dA=(1/B) dQ/dh= kinematic
wave speed (B=
channel top width; h= flow depth;
A=flow area); D=Q/(2BS)=diffusion
coefficient (S=channel bed slope).
Cunge
proved that the conventional Muskingum equations are assimilable to a
convective-diffusive equation like (1), if the numerical diffusion is
equated to the physical diffusion (D, eq.1). Developing this hypothesis in a computational space-time
grid, it follows:
|

|
(2)
|
where
the variable parameters gi
are expressed by the relations:
|

|
(3)
|
with
P=2D/(c Dx) and
N=c Dt/Dx..P
and N parameters are computed
by averaging the three respective values coming from point 1, 2 and 3.
For
the evaluation of the kinematic speed (c)
of a debris flow it is necessary an assumption on the joint between the
surge depth (h) and its velocity (v).
This assumption may be supported by the analysis of the observed maximum
velocity field data in monitored stream. Even if different rheologic models
may interpret the debris flow movement, the analysis of precise measurements
of several granular surges moving on a mobile bed shows the capability
of the Newtonian flow to give
acceptable results. Some authors estimated the flow resistance in terms
of the dimensionless Chezy coefficient (C*).
They obtained that most data are included in the region:
|

|
(4)
|
where
S =sin q;
q=
inclination angle of the channel and h is the surge depth (m).
The adoption of eq.(4) linked with the hypothesis to equate the energy
slope to the bed slope, allows both the computation of the kinematic speed
(c=1.5 v) and the surge depth
associated to the flow rate
 . .
Following the above described procedure, the model MODDS (Muskingum One-Dimensional
Debris flow Model) has been developed for a channel geometry described
by eight points. Each of these contains three absolute coordinate (X and Z in the cross-section
plan and X and Y for a plan view). In addition 3 additional points are
automatically generated by the program: point 9 represents the channel
axis, points 10 and 11 are fictitious points, located vertically 50 m
above point 7 and 8 respectively. Points 10 and 11 are necessary if the
bank overflow has been prevented by the user (the setting of this option
may be useful in a design perspective) or if
the overflow occur (above point 7 and/or 8) and temporary cross-section
parameters have to be evaluated for a given depth (h).
The described computational approach has been developed using the Borland
Delphi 5.0 language.
Furthermore, the program estimates surface superelevations in bends, the
presence of bridges, the diversion of the flow due right and/or left bank
overflowing.
A summary of input parameters
and output results in presented in the appendix.
In
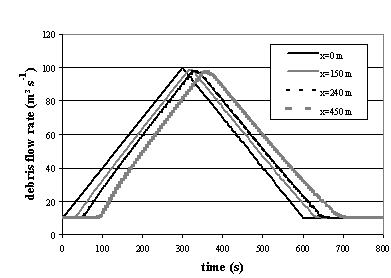
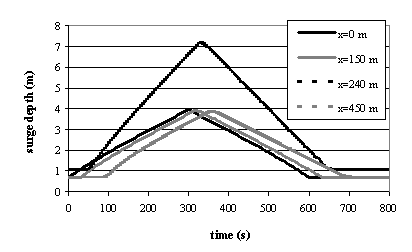
figures 1-2 the results of an application are shown considering a channel
having a rectangular cross-section
and a constant slope equal to 19% (the same of the Rio Lenzi, Trento –
Italy, along the fan). The channel is 5 m wide for the firsts 210 m, it
follows an abrupt narrowing to 3 m for a 30 m long reach, after which
the channel enlarged again to 5 m for the remaining 210 m. The input debris-flow
hydrograph is triangular shaped with a peak value equal to 100 m3
s-1 and the assumed roughness C*
is 3 for the whole channel.
The computation
has been conducted choosing a Dx
value ranging from 20 m - in the narrowing - to 50 m - in the remaining reach - and
a Dt
value of 5 s.
The model responds satisfactorily to the sharp input hydrograph and to
the narrowing. The pattern of flow rates with time (fig.1) at different
locations shows a certain lamination of the peak discharge and a progressive
smoothing of the initial triangular input hydrograph. The depth pattern
for the cross-sections inside the narrowing increases markedly (fig. 2)
and returns downstream of the contraction to values comparable with those
upstream of the narrowing.
The volume conservation is still acceptable for a debris flow wave, because
the entering sediment volume of 33000 m3 of the initial cross-section
becomes equal to 33650 m3 in the terminal one, with a volume
increase equal to 2%.
|

|
Figure
1 - Debris flow routing trough a rectangular channel 450 m long
(C*
= 3; S = 19%; width
B = 5 m; abrupt narrowing to B =3 m fromx
= 210 m to x
= 240 m):
low
rates hydrographs
|
|

|
Figure
2 - Debris flow routing trough a rectangular channel (same conditions
of figure 1):
surge depths hydrographs
|
APPENDIX
INPUT
PARAMETERS
General
simulation data:
-
Input
discharge time interval (s)
-
Simulation
duration (hours)
-
Temporal
integration step (s)
-
Bend
superelevation coefficient α
General
boundary conditions:
-
Intial
discharge (m3s-1)
-
Peak
discharge (m3s-1)
-
Final
discharge (m3s-1)
For
each section of the channel:
-
Mean
reach gradient
-
Non-dimensional
Chèzy coefficient
-
Longitudinal
distance from the initial point of the simulation (m)
-
Cross-section
coordinates (8 points)
-
Bridge
characteristics (thickness and position)
OUTPUT DATA
At
each cross-section for each time step:
 
|


